


Want to know how users engage with your website or email? There’s no better way than with a click map. A click map reveals where users are clicking on your project. A form of heat map, it reveals which areas of your design are most and least engaged with, allowing you to better understand how to make adjustments based on user actions. By learning how to read a click map, marketers and designers alike can implement data-driven layout changes to better support user intent for improved UX and higher conversions. Below, we teach you how to read a click map so you can create a more effective layout based on learned user engagement.
H2: What Is A Click Map?
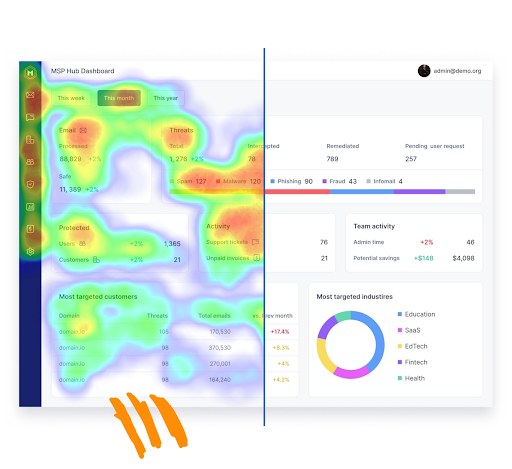
A click map is an image that showcases where users interact with your layout and go to access links, press buttons, or images. WordPress alternatives that support advanced analytics integrations make it easier to generate and analyze these click maps directly within modern content workflows. Typically rendered in heat map style, a click map can almost instantly show you which areas of your layout are most traveled or popular and whether or not your audience is engaging with what you have to offer. Areas that are darker, brighter, or more saturated show engagement while cooler or less visible areas spotlight less desirable spots. For marketers, it’s a quick gauge of the effectiveness of layouts rendered with the correct details to back up why.
H2: Where Are Users Clicking the Most?
It’s a good thing when you find certain areas get the most clicks consistently. This means that users want to see your images, your call-to-action (CTA) intrigues them, and your navigation links are accessible without frustration. Therefore, when these high-engagement areas become visible because of click mapping, marketers instantly know what works well and what people actually want. When you understand the effective options, you can replicate similar emphasis in future layouts as well as strategic decisions that keep them in the right places going forward. This way, you have the means to replicate success and ensure that what’s working will continue to get consistent attention. You’ll know that this area works really well all the time, so plan for it even if things change down the line.
H2: Where Is Content Not Performing?
Where content isn’t performing is easy to identify which buttons or links are never clicked images that don’t receive a lot of visibility. If sections of content aren’t seeing a lot of clicks, they’re poorly worded, placed visually incorrectly, or ineffective in general. Because click maps show marketers where a layout could use strategic reassessment, they make it easier to identify where the problems are and reposition for better visibility, effectiveness, and success. This is a proactive measure to ensure the user experience is better they’re trying to engage with your site; make sure the components they care about or will benefit from are used, not ignored.
H2: Improving Navigation Through Click Patterns
Navigation is key to user experience and conversion. Click maps determine how well navigation works throughout your design. Are people clicking on the navigation bar or subheadings in dropdowns? Clearly, they understand where they’re going. Are they clicking all over the place, or trying to get back to places they didn’t intend to go after being sent to other places? This could indicate a problem with navigation or an issue with the design itself. Adding improvements to navigation based on this information decreases user frustration and dramatically improves user experience, allowing people to get where they need to go better and faster.
H2: Enhancing CTA Locations with Click Maps
Conversions often occur based on where and how calls-to-action (CTAs) are presented. The data from click maps can help assess where CTAs should go by understanding what users actually do. For example, if you see lots of people clicking on a CTA in one location, that’s a successful spot. If you see that barely anyone is clicking there, that location needs to be assessed to understand if it’s an access issue, messaging, or visibility. Determining proper CTA locations based on click map data makes sure they are appropriate, accessible, and visible, which increases effective engagement with users and conversion potential.
H2: Assessing Graphics and Imagery Impact
Graphs, images, and other interactive components can change how users feel about content and engage with it. Understanding how effective these graphics are in garnering attention can be assessed using click maps. If users are frequently clicking around graphics or on images, this is a positive sign they’re engaging and interacting. However, if almost nothing is visually clicked, it could suggest it’s irrelevant or unclear as to what the image is trying to say. Assessing this visual engagement allows designers to select or alter images that help engage users positively to create emotional connections that foster better overall content effectiveness.
H2: Learning of Expectations and How They Avoid Marketing Efforts
Learning of user behaviors through click maps often translates into known expectations already established or what users feel they should know or be doing naturally. If users are clicking in certain areas, either a lot, it’s because they expect the information they need there (and/or it’s a hot spot) and therefore, real-time understanding of need versus expected integration becomes much easier. If marketers know what’s expected and when through click mapping analysis, they can better facilitate future content creation. Knowing of expectations makes layout relevance that much more accurate as designers can anticipate what information should be there and why to enhance overall satisfaction.
H2: Understanding What Works for Mobile vs. Desktop
Another consistent occurrence made possible by the use of click maps is the understanding of what works better for mobile versus desktop. Users tend to interact with certain layouts better on mobile devices versus computers. These differences can be acknowledged and addressed when the click maps showcase the discrepancies. By analyzing each differently but at the same time through one click map, it assists in better understanding how to cater to both situations with smaller button sizes, greater accessibility related navigational issues, or even images that can be blown up or minimized when appropriate depending on the platform. This ensures effective engagement on all levels; only by seeing what’s usually differentiated by click maps can all platforms come together to create a maximally effective experience.
H2: Learning Where Content Should Be Important And Why
Ultimately, the best reason to use a click map study after a site design has already been put into play is to understand where content is important and where it is not. Click maps provide clear, effective data for what people are enjoying and engaging with the most; if a specific section is clicked and engaged with as anticipated, this content must be expanded or prioritized. On the contrary, if something isn’t clicked and engaged with as anticipated (and it’s not positioned expectedly due to necessity), this may need to be reworked, moved, or taken out. With the ability to understand where content should be prioritized and where it needn’t be seen ever, marketers can make moves to ensure constant user engagement with what users want most where it belongs without making something you need to fight tooth and nail for attention. This ideal engagement makes everything more relevant, in fact. Ultimately, proper content prioritization makes everything more engaging.
H2: Layout Distractions
Click maps reveal distractions within a layout, places where a user is not meant to go or becomes so confused that they click elsewhere. When an image or blank space gets multiple clicks, it indicates that people aren’t sure what it is, or they’re distracted; the intended functionality remains unclear. Yet, knowing where distractions lie can help a designer determine necessary improvements, whether to clarify images, relocate distracting logos or tools, and overall simplify visual aesthetics. Distractions are the antithesis of clarity and frustrate users; knowing where they lie helps avoid these mistakes to let the user interface and engage seamlessly without distraction.
H2: A/B Testing with Click Map Findings
The findings of a click map lend themselves to A/B testing opportunities. When something is overwhelmingly clicked, there’s a place for testers to start. Similarly, if something is creating confusion, testing out different options related to that piece of data is beneficial. For instance: placement of buttons, different images to clear up confusion, or different navigational features would all be good opportunities stemming from statistical assessments via prospective click-through enhancements. By continually referencing click maps for A/B testing opportunities along the way, data can be used instantly for the best layout improvements.
H2: Click Maps with Other Analytics
Click maps can help in conjunction with other analytics to paint a fuller picture. For instance, if click data reveals a certain portion of your layout is consistently clicked but there’s also a significant bounce rate on that page, you know there’s confusion, which other analytics can help clarify context and decide what needs to change. By using more than one data point to assess layout changes, comprehensive needs and experiences are taken into account to render more successful engagement opportunities in the future.
H2: Analyze Click Map Inclusions Against User Goals
Comparing inclusions on a click map with user goals ensures that your design is made for purposeful involvement and active user experiences. If users are clicking a lot in the areas that you want them to, you’ve accomplished their goals. If, however, you have set intentional goals for users, and they are clicking all over the place or clicking more than anticipated, there’s some confusion. This helps you know where you’ve accomplished goals, as you can better differentiate content and navigation in these areas since you’re purposely helping them get to where they need to go (and start) from the beginning. The more you do this the better, as ongoing engagement and satisfaction will continue to empower successful endeavors.
H2: Analyze Scrolling to Supplement Clicks
Click maps are even better when used alongside scroll maps, as they provide a more comprehensive view of engagement across the page and how people are processing your information. Scroll maps show how far people scroll and where engagement basically stops showing you what’s visible versus invisible when it comes to interest and understanding. By using these two forms of research, you can see whether less engagement is because the information isn’t good, or because it’s too low, or for no reason at all. The more you use click maps with scroll maps, the better your understanding of behavior will be so you can create changes from there.
H2: Use Click Maps Over Time
Using click maps over time allows marketers to see changing user behavior, preferences, and expectations. Tracking click maps over time allows for trends and seasonal changes to be applied quickly for significant layout or preference changes. Without using click maps over time, businesses and companies may miss crucial opportunities for improved placement and topical relevance. Using click maps over time can ensure that your layout is successful for the long game.
Conclusion: Turning Click Map Insights into Actionable Improvements
Regularly analyzing and interpreting a click map allows for ongoing adjustments, rendering insights into user behavior for visual changes as they literally show what people are doing with your layout and content. For example, strong engagement increases find certain elements, disclosed via heat maps, showing where people clicked more often and designers and marketers duplicated that success elsewhere in the layout. Conversely, if something is not clicked where expected, then it’s frustrating for that content or design element, and adjustments can be made to avoid wasting time and money. Instead, time and efforts can be focused on weak areas which have been determined to need attention to bring them up to speed with the rest of the layout.
Moreover, interpreting a click map provides insights into what users expect because it shows people where they expect to find something, be it information or a product. This allows marketers and designers to realign their goals with expected successes to create better usability and navigation. At the same time, this serves as a frustration indicator because if something is there and it’s not clickable or a confusing button, this means that the layout is distracting. Designers can replicate this understanding to avoid such detours and further clarify user experience, which can help avoid bounce rates or similar frustrations in the future.
Ultimately, using a click map for ongoing adjustments ensures that brands are consistent with changing demands, user options, habits, and trends. The sooner the complications to usability are addressed, the better they’ll be for subsequent experiences. Over time, a brand would just naturally rely on click maps for adjustments to layouts as time goes on; without these refinements, layouts become stale or unappealing. Instead, regular refinements keep layouts fresh and allow for the satisfaction rate to improve over time.


